- Buatlah datasource yang diperlukan.
- Buatlah sebuah chart (bar/line) sesuai kebutuhan (untuk contoh berikut bar chart yang dibuat terlebih dahulu).
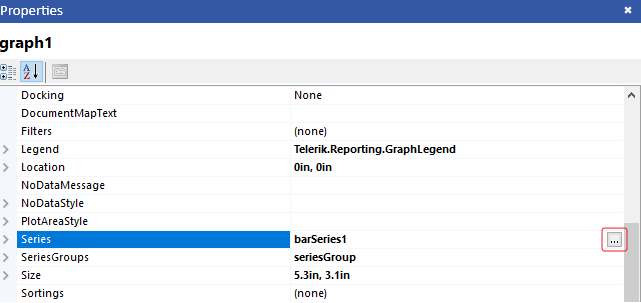
- Setelah chart berhasil dibuat, pilih Series pada chart properties.
- Click panah pada tombol Add dan pilih chart yang diinginkan (untuk contoh ini pilih Line Chart).
- Isi properties line series sesuia gambar (untuk toolip dan Y isi sesuai kebutuhan, dan yang lainnya isi sesuia pilihan yang ada).
- Click OK, chart line bar selesai.
 Langkah no. 3
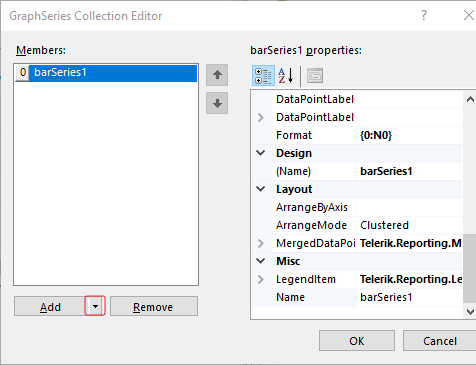 Langkah no. 4
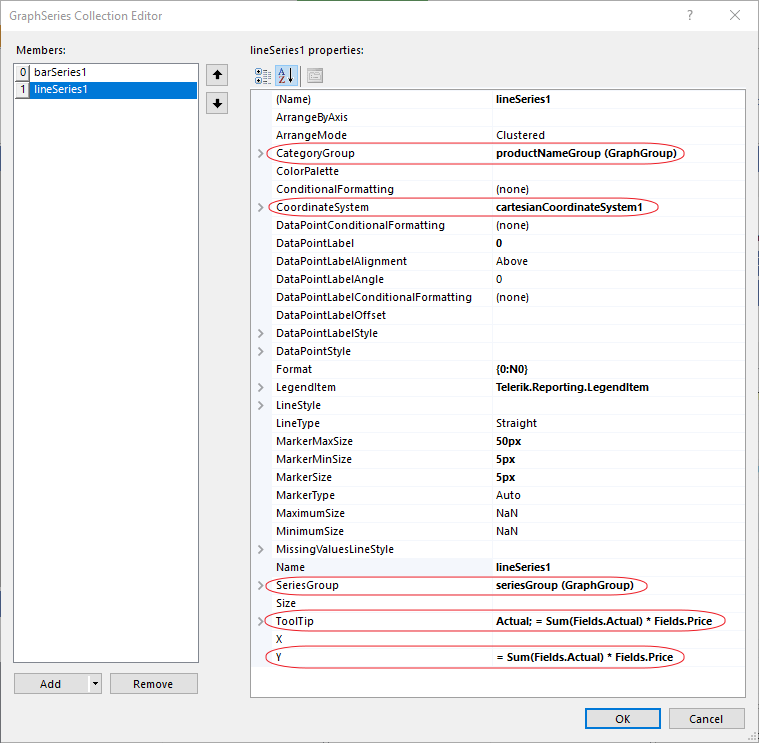 Langkah no. 5
0 people found this article useful
0 people found this article useful